
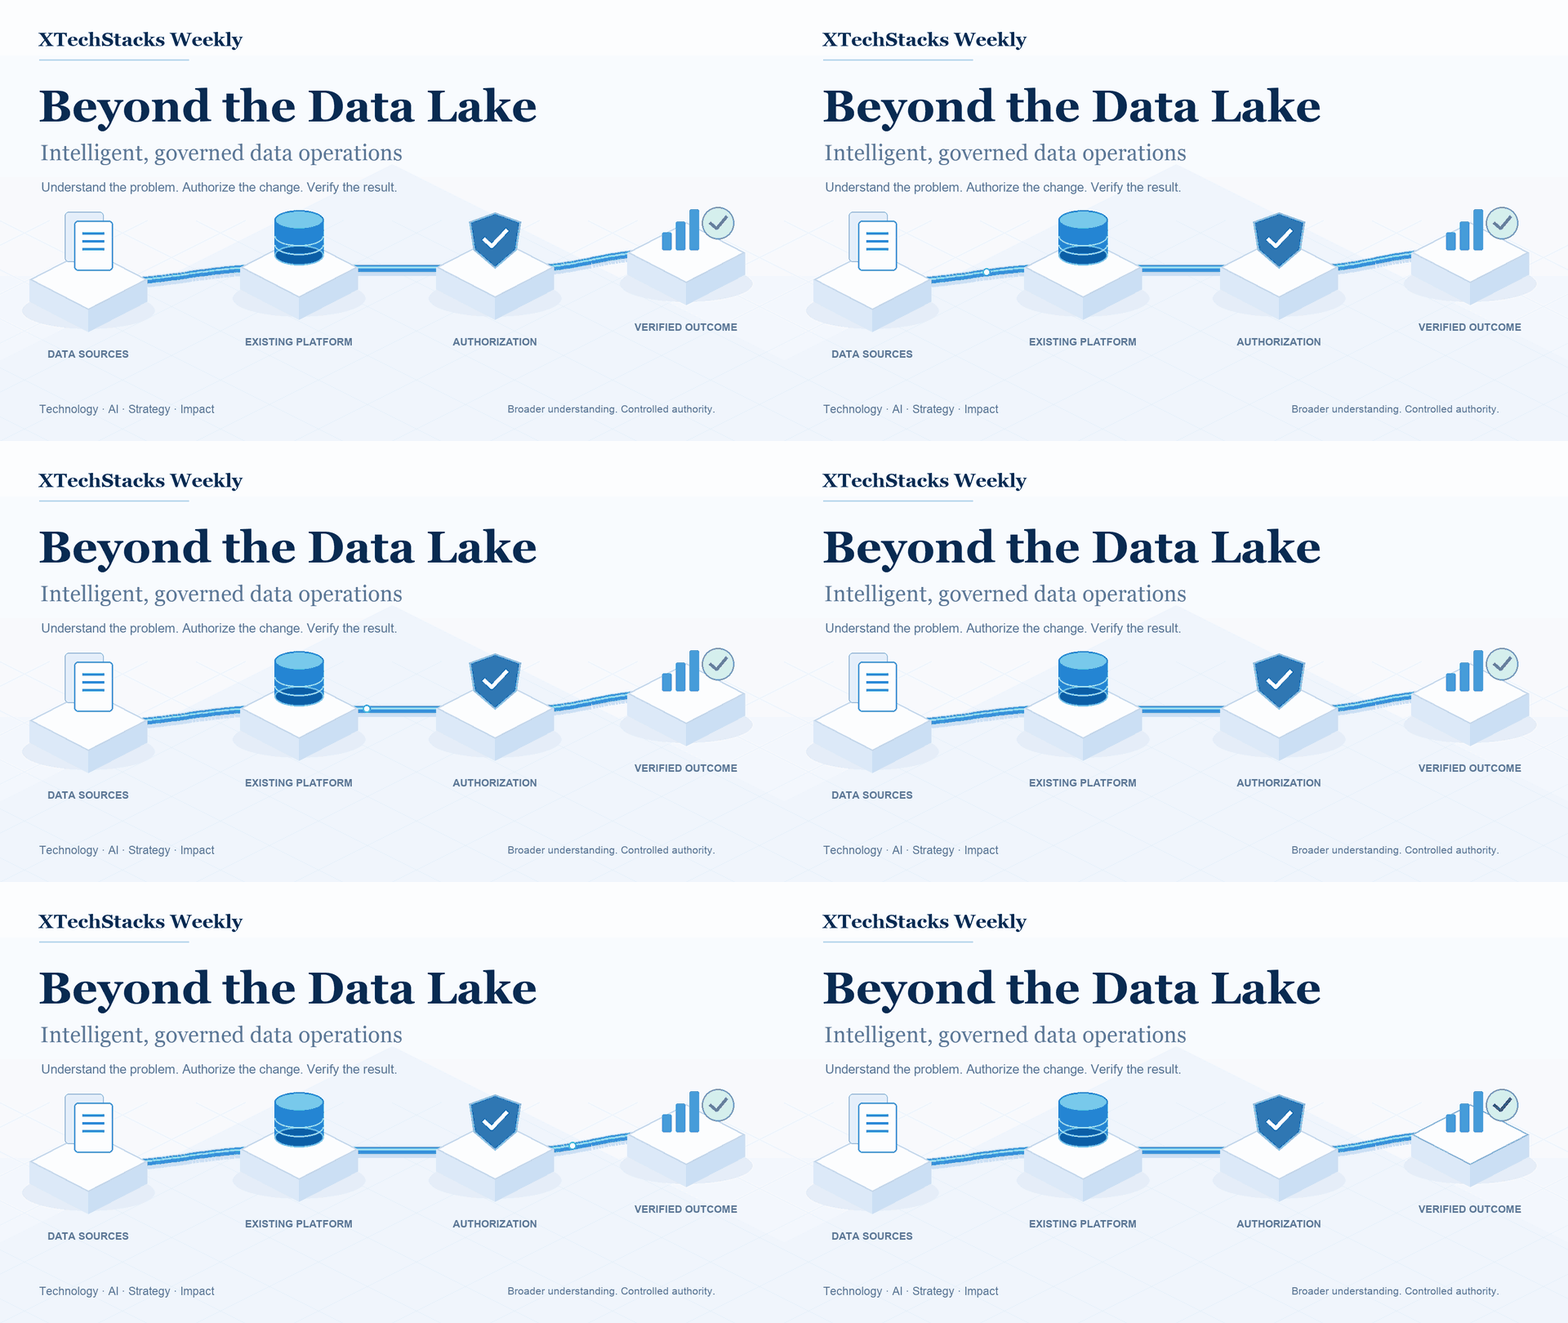
The next evolution of enterprise data platforms may be less about collecting more information and more about helping teams correct the information they already depend on.
In this edition
- Why technically healthy pipelines can still produce the wrong business answer.
- A six-stage Data Intelligence Loop, from discovery to verified remediation.
- An architecture that separates AI reasoning from permission to change data.
- A worked financial example, five operating measures and a focused 30-day pilot.
The pipeline passed. The revenue number did not.
Imagine a Monday morning finance meeting. The executive dashboard reports an 18% increase in revenue. The pipelines completed, the tables refreshed and the monitoring dashboard is green. Finance expects growth closer to 3%.
The investigation crosses three teams. Engineers review transformations, analysts trace reports, and finance reconciles the output against the ERP. An upstream currency-mapping change eventually emerges as the cause: some transactions were converted incorrectly.
This is an illustrative scenario, not a customer incident or measured result. Its lesson is familiar: technical availability and business correctness are different acceptance criteria. A successful pipeline run establishes that a process finished; it does not establish that the reported revenue is right.
Now imagine the platform identifying the discrepancy, tracing the affected reports and proposing a correction before the meeting. It still needs an authoritative source, a business owner, appropriate permissions and independent validation before changing anything.
The useful question is not whether a data lake can repair itself. It is whether the surrounding platform can help people reach a safe, verified correction faster.
Why this matters now
Iron Mountain’s October 19, 2026 research announcement reports that 86% of surveyed organizations experienced AI-project delays or cancellations because of data concerns in the preceding year; 70% could not effectively track the lifecycle of data used in their AI models. These are sponsor-reported survey findings, not universal enterprise rates.
There is a second problem: deciding which signals deserve action. Monte Carlo’s State of Data Quality for 2026 report, page 6 says 34% of incidents in its aggregated troubleshooting telemetry were expected variations or intentional changes. This describes the vendor’s observed environments; it is not a benchmark for every data estate.
Together, these findings support an architectural priority: connect detection to business context before increasing automation. An alert without context can create work. A plausible AI explanation without evidence can send that work in the wrong direction.
Five gaps another dashboard will not close
1. An inventory is not a shared business definition
Two tables can both contain customer_id while describing different entities: a legal customer, an individual account or a billing relationship. Names and embeddings cannot settle that distinction. Owners need to confirm the meaning, valid joins and effective dates.
2. Technical severity is not business impact
Missing values in an optional description field may be harmless. Missing payment identifiers can stop supplier payments. Prioritization needs the affected process, contractual expectations and downstream consumers, rather than anomaly size alone.
3. A downstream cleanup can leave the source defect intact
Deleting duplicates from a reporting table may restore a dashboard for a day. If ingestion replays the same events tomorrow, the failure returns. Remediation needs a root-cause hypothesis and a test showing why the proposed change should prevent recurrence.
4. A governance document does not enforce a runtime decision
Ownership and classification help teams make decisions, but the execution path must still enforce access, approved scope and change controls. A repair job needs its own bounded identity; a model’s recommendation must not become a permission grant.
5. An anomaly is not permission to rewrite data
A duplicate may represent two legitimate entities. A schema change may be an approved release. Some incorrect values cannot be reconstructed reliably. The correct response may be investigation, quarantine or escalation rather than an automatic update.
A practical framework: the Data Intelligence Loop
This is an XTechStacks architectural proposal for combining existing capabilities. It is not a formal standard, a claim that data lakes already possess business understanding, or an announcement of an autonomous XTechStacks product.
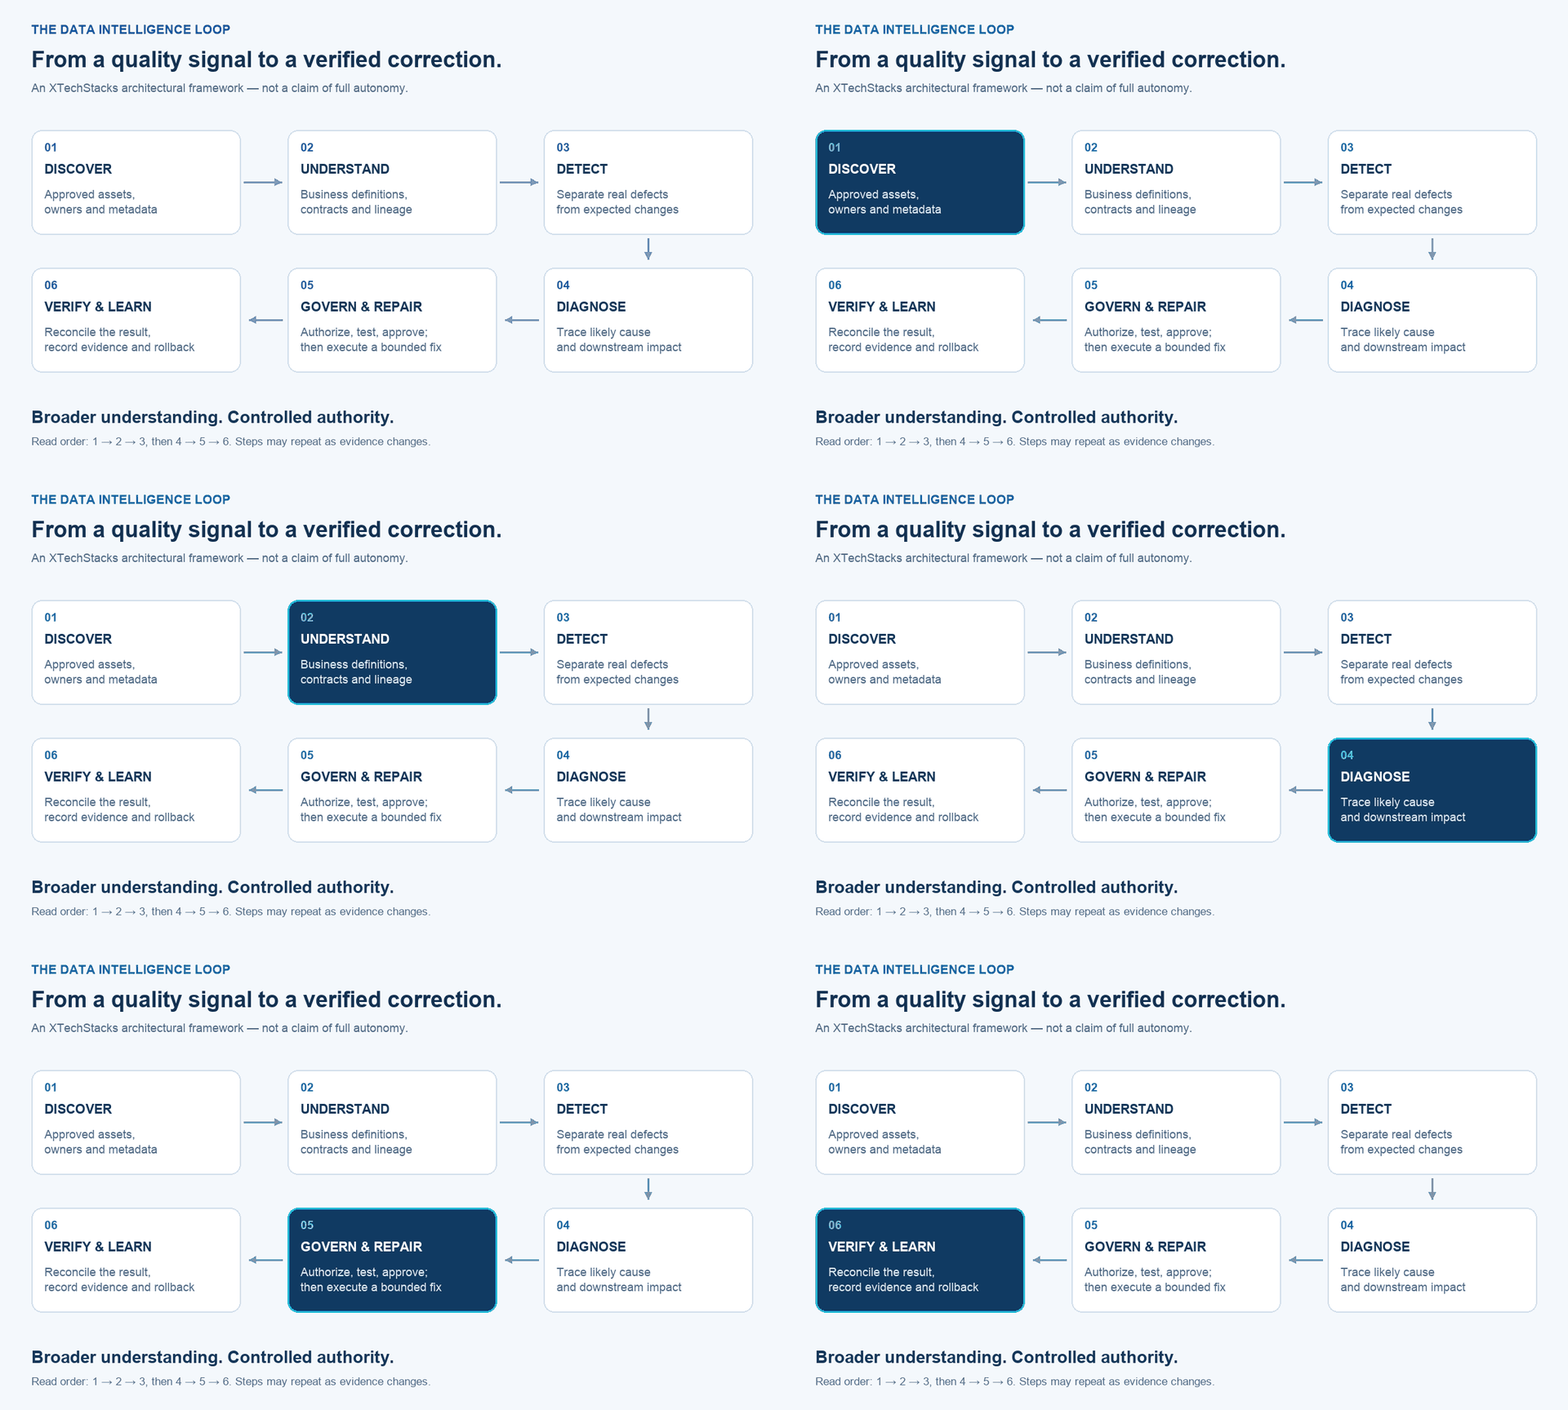
1. Discover: establish the permitted inventory
Connect to approved catalogs, pipeline metadata and ownership records. Start with one domain and document which sources are in scope. Collect metadata where it is sufficient; copying raw enterprise data into another service should require a separate, justified decision.
2. Understand: attach meaning and evidence
Connect datasets to business definitions, contracts, transformation versions and consumers. Distinguish an owner-approved relationship from an AI-inferred candidate. Record provenance, confidence and the last verification date so an uncertain interpretation cannot quietly become an operational rule.
3. Detect: identify a meaningful deviation
Combine schema, freshness, completeness and reconciliation checks with statistical signals. Compare alerts with release calendars, known seasonality and approved changes. Where the evidence is inconclusive, open an investigation instead of inventing a correction.
4. Diagnose: build a testable explanation
Use lineage, run history, source changes and transformation versions to identify plausible causes and affected consumers. Show the supporting evidence and competing explanations. Lineage can identify a dependency; it does not by itself prove causation.
5. Govern and repair: authorize a bounded change
Classify risk, select an approved action and test it against a snapshot or isolated output. Define the target partitions, expected changes, expiry, stop conditions and rollback before execution. Financial corrections and identity merges should require the designated business authority.
6. Verify and learn: check the resulting business state
Reconcile against an independent source and test both the intended correction and unaffected data. Retain an audit record of approval, execution and verification. Confirmed findings can improve a reviewed runbook; learning should not silently broaden permissions or retrain a model on private records.
The architecture: reuse the platform, separate the controls
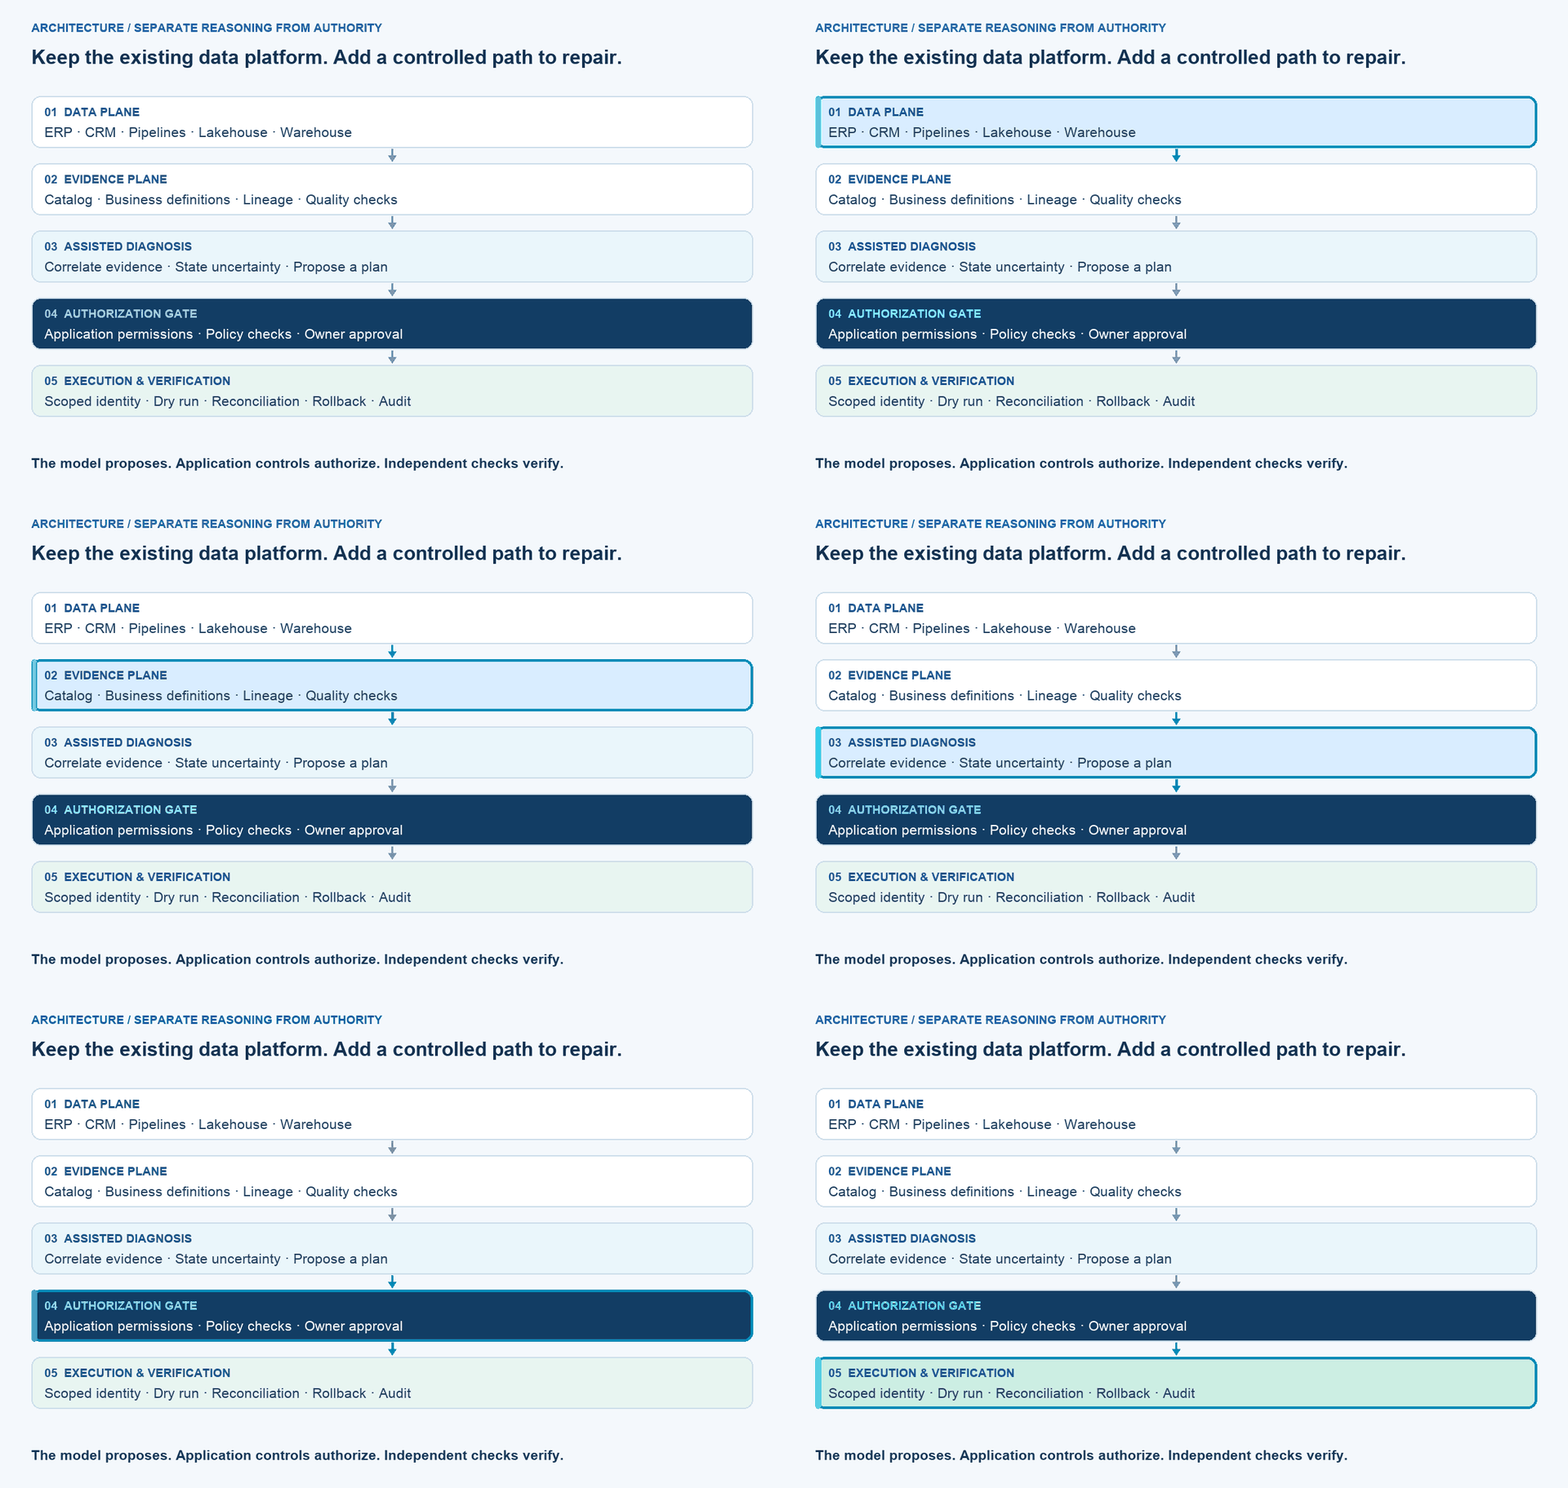
The integration can sit above an existing lakehouse or warehouse, using catalogs, quality tools, orchestration and incident systems already in place. OpenLineage’s object model provides dataset, job and run concepts for recording dependencies and executions. That is useful evidence for investigation, not an authorization mechanism.
Microsoft’s Purview planning documentation likewise distinguishes the technical asset inventory from the business-facing catalog. It explicitly notes that catalog roles do not grant access to the underlying data. A repair workflow needs separate application and data permissions.
Keep deterministic checks in code. Let AI correlate evidence, explain possible causes and draft a repair plan. Treat retrieved descriptions and documents as untrusted input, minimize sensitive data sent to the model, and enforce action limits outside the prompt. If the provider times out, evidence is missing or the plan exceeds scope, the workflow should stop or hand off.
A worked example: repair the currency rule, then prove the revenue
Return to the illustrative finance dashboard. The starting signal is a reconciliation difference between the ERP and the reporting layer—not merely an unusual growth percentage. A seasonal sales spike could be legitimate.
- Collect evidence: compare source totals and reporting totals by currency, business date and entity. Identify the transformation and mapping versions used for the affected partitions.
- Test the cause: reproduce the discrepancy in an isolated run. Check whether a mapping change explains it; keep alternative causes open until the evidence resolves them.
- Propose the repair: correct the transformation or approved reference mapping in version control. Avoid patching source financial transactions simply to make a dashboard reconcile.
- Obtain approval: the finance owner approves the expected treatment; the data owner approves the scoped deployment and replay.
- Execute once: use a stable incident/action identifier and an idempotent procedure for the approved partitions. Re-check the input version before writing so a newer source change cannot invalidate an old plan.
- Verify independently: reconcile the rebuilt output, inspect unaffected partitions and refresh affected downstream reports. A failed check leaves the incident open and triggers the prepared recovery path.
The acceptance criterion is a reconciled, approved financial result with evidence. It is not simply “the job succeeded” or “the AI says the issue is fixed.”
Which actions should be automated?
| Situation | Permitted response to design |
|---|---|
| Transient ingestion timeout | Bounded retry only when the operation is safe to repeat, with a retry ceiling and verified output. |
| Unexpected schema change | Validate compatibility and isolate affected output where an approved contract permits it. |
| Incorrect transformation | Propose a versioned code change; test and approve before a scoped replay. |
| Possible duplicate identities | Provide matching evidence for a data steward. Do not merge identities on model confidence alone. |
| Sensitive data exposure | Escalate to security; use only pre-authorized containment actions. |
| Financial reconciliation error | Require the designated business owner’s approval and independent reconciliation. |
The economics: measure gross benefit and operating cost
Consider a hypothetical enterprise with 25 meaningful data incidents per month. At five investigation hours per incident and an assumed fully loaded rate of $80 per hour, investigation costs $10,000 monthly. Add four downstream corrections at an assumed $1,500 each and the illustrative baseline is $16,000 per month.
If assisted investigation reduces effort to three hours per incident, and downstream corrections fall from four to two, the same calculation becomes $6,000 plus $3,000: $9,000 per month. The difference is $7,000 monthly, or $84,000 annualized gross benefit.
These figures are arithmetic assumptions, not a forecast or a measured customer outcome. They exclude implementation, licenses, model calls, approval effort and ongoing operations. Net benefit could be smaller or negative; compare those incremental costs with observed savings before expanding the pilot.
Five measures for the operating dashboard
- Time to detect: measure from a defined onset or earliest observable defect; document when onset is unknown.
- Time to verified resolution: finish the clock after correctness checks, not after the repair job exits.
- Recurring defect rate: track repeat incidents from the same confirmed cause over a fixed period.
- Business impact: count affected reports, processes or customers without double-counting the same incident.
- Cost per verified resolution: include investigation, approval, execution, verification and tooling costs.
For automated actions, also track unnecessary interventions, verification failures and rollbacks. Segment results by domain and risk. Faster resolution of low-risk freshness issues should not conceal incorrect financial repairs.
A focused 30-day starting plan
Week 1 — establish visibility. Choose one critical domain: finance, inventory, suppliers or customer reporting. Name its owner, authoritative source, approved consumers and success criteria. Establish a baseline before introducing assistance.
Week 2 — understand recurring failures. Review a representative set of incidents. Classify causes, evidence gaps, business consequences and manual effort. Separate legitimate variations from defects.
Week 3 — introduce assisted diagnosis. Run with read-only access. Compare proposed explanations with engineer-reviewed findings. Test missing lineage, stale metadata, misleading source descriptions and provider failure.
Week 4 — test one bounded repair. Select a reversible action, approve its runbook and rehearse dry runs, repeat execution, changed inputs, revoked access, partial failure and rollback. Expand only after independently verified results justify the cost and risk.
The opportunity is a shorter path from uncertainty to evidence
Enterprises do not need another system that labels every anomaly an emergency. They need a dependable path from a quality signal to an explanation, an authorized action and a verified result.
The intelligent data lake is a useful ambition when it means connecting metadata, business context, governance and operations. Its understanding can become broader while its authority remains deliberately constrained.
What happened? What is affected? What correction is allowed? And what evidence proves the problem is resolved?
Those are the questions that turn data intelligence into an operating capability.
A question for technology leaders
When a data-quality issue appears in your organization, where does the most time go: detecting it, understanding its business impact, or getting a verified correction into production?
Tell us about the challenge. XTechStacks can help you frame an architecture review or a bounded data-reliability pilot.
— Atul Yadav
Technology · AI · Strategy · Impact
Continue reading
Last week’s edition on AI-agent production reliability explored verified workflow outcomes. This edition applies that discipline to data operations. For the implementation foundation, explore data versioning with DVC.
Get practical perspectives on enterprise AI, architecture and engineering: subscribe to XTechStacks Weekly.
Sources and editorial transparency
- Iron Mountain: The AI Readiness Illusion, October 19, 2026. Sponsor-reported research; used for the two attributed survey figures above.
- Monte Carlo: The State of Data Quality for 2026, page 6. Vendor telemetry; its observed incident mix is not an industry-wide rate.
- OpenLineage: Object Model. Technical reference for dataset, job and run lineage.
- Microsoft Learn: Plan for data governance with Microsoft Purview. Technical reference for catalog planning and the distinction between metadata roles and underlying data access.
Editorial note: Sources checked October 24, 2026. The framework, architecture, diagrams and scenarios are XTechStacks editorial analysis, not claims of an implemented product or completed customer deployment. The finance scenario and cost model are hypothetical. AI assisted preparation of this draft. Questions or corrections can be sent through our contact page.